Why is weather data?
I started this project when moved to USA to work for software development company. I'm living in Owosso, MI and I wanted to have good source of local weather data.
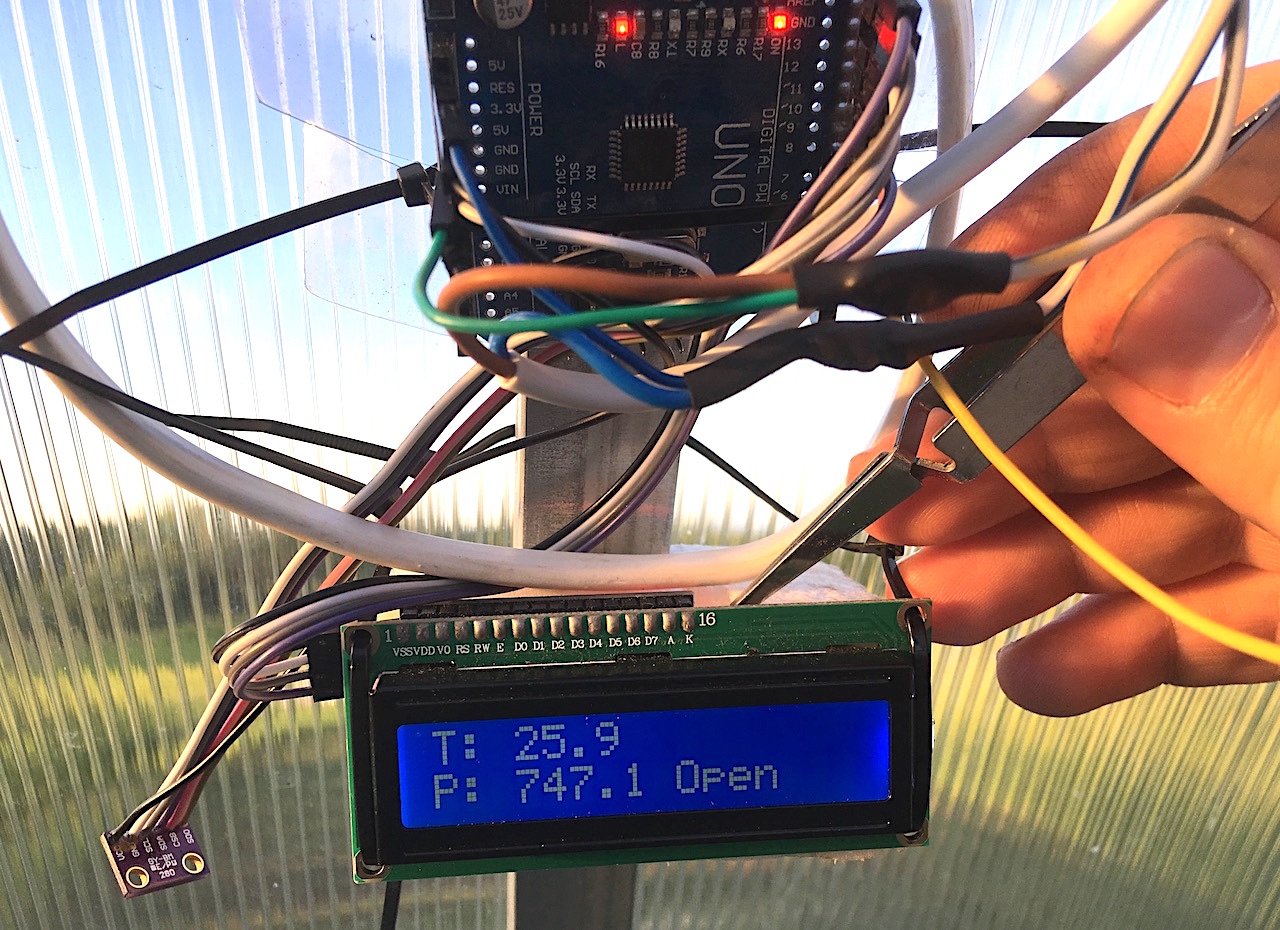
I already had experience programming Arduino and chose it as a familiar device. I used Arduino Uno for a greenhouse ventilation system.
I also have bought simple weather station from Amazon to check if my project returns correct numbers. Spoiler alert: It does not :(
Ok. I'm not even sure if the device from Amazon is correct :) Anyway, there is always opportunity to grow: I deffinetly will try different sensors to get better results!
Arduino Project
I like Arduino as it's a simple and a powerful device to work with.
There are variety of developers and enthusiasts who make lots of projects from weather station (like myself) to drone control system.
Arduino can work with different weather sensors and I chose BME280 because it has the biggest range of values for temperature.
Also this sensor returns humidity and air pressure values. This is all I need.
This time I chose controller ESP8266 as a mainboard. Those devices (ESP and BME) are small and powerful. ESP8266 has Wi-Fi module to connect to my network which is necessary in my case.

Author: Vowstar, CC BY-SA 4.0, Link to the source
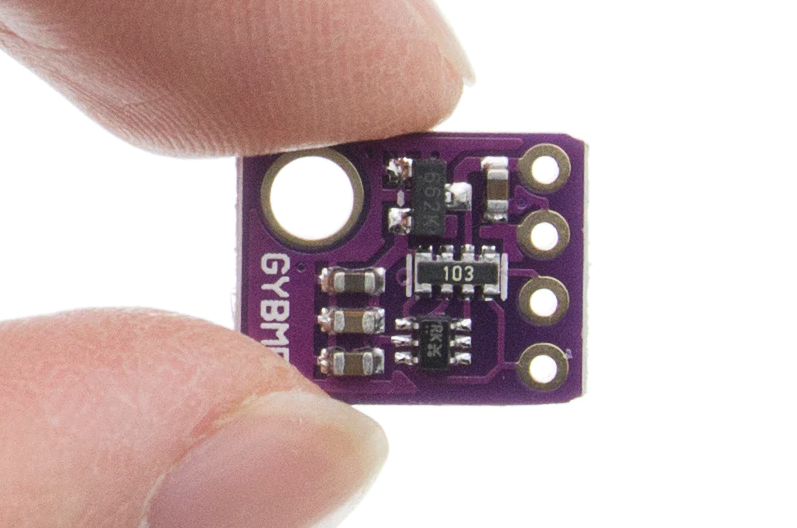
BME280 sensor
After choosing elements of future weather station I decided to make a box for it. I created the box in Fusion360 - great software for engineers.
Then I printed it on 3D printer and here is what I got:
Collecting Data
So my weather station now can connect to home Wi-Fi network every hour to send data to the site.
Special code takes the data and put it in the database. Here is a glimps on what I keep in DB:
| id |
location |
reading time |
sensor |
value1 |
value2 |
value3 |
| 2734 |
Home |
2020-07-02 10:53:11 |
BME280 |
35.89 |
31.00 |
743.68 |
| 2733 |
Home |
2020-07-02 09:53:11 |
BME280 |
31.11 |
41.63 |
743.61 |
| 2732 |
Home |
2020-07-02 08:53:11 |
BME280 |
27.30 |
49.24 |
743.54 |
I had some problems with my data. One is - reading time. My web site is hosting on server in Russia and reading time is the time when the record is added to the DB.
So it is Moscow time - UTC +3. To make it look like US Eastern Day Time I have to substract 7 hours which is difference between Moscow in Russia and Owosso in Michigan.
So in the table you can see correct date and time for Owosso, MI.
Another problem was the temperature data. The sensor returns Celsius. But Americans use Fahrenheit! Well, not a problem - convert Celsius to Fahrenheit :)
Here is a code to do it:
              // calculating data for Fahrenheit chart
              let value4=[];
              // rounding up the results
              for (item of value1){
              value4.push(Math.round((((item*9/5)+32) + Number.EPSILON) * 100) / 100);
              }
It is JavaScript. In this example I create a new variable value4 which is array. Here I take the temperature in Celsius from DB (value1) and converting
it to Fahrenheit and rounding up those values. Then putting it to a new array - value4.
Now I have 4 arrays: value1, value2, value3 and value4 with temperature in Celsius, humidity, air pressue and temperature in Fahrenheit respectively.
The next step is to create charts.
Charts
I google the question about charts and found a solution on HighCharts. It is free for personal use.
Examples of charts:
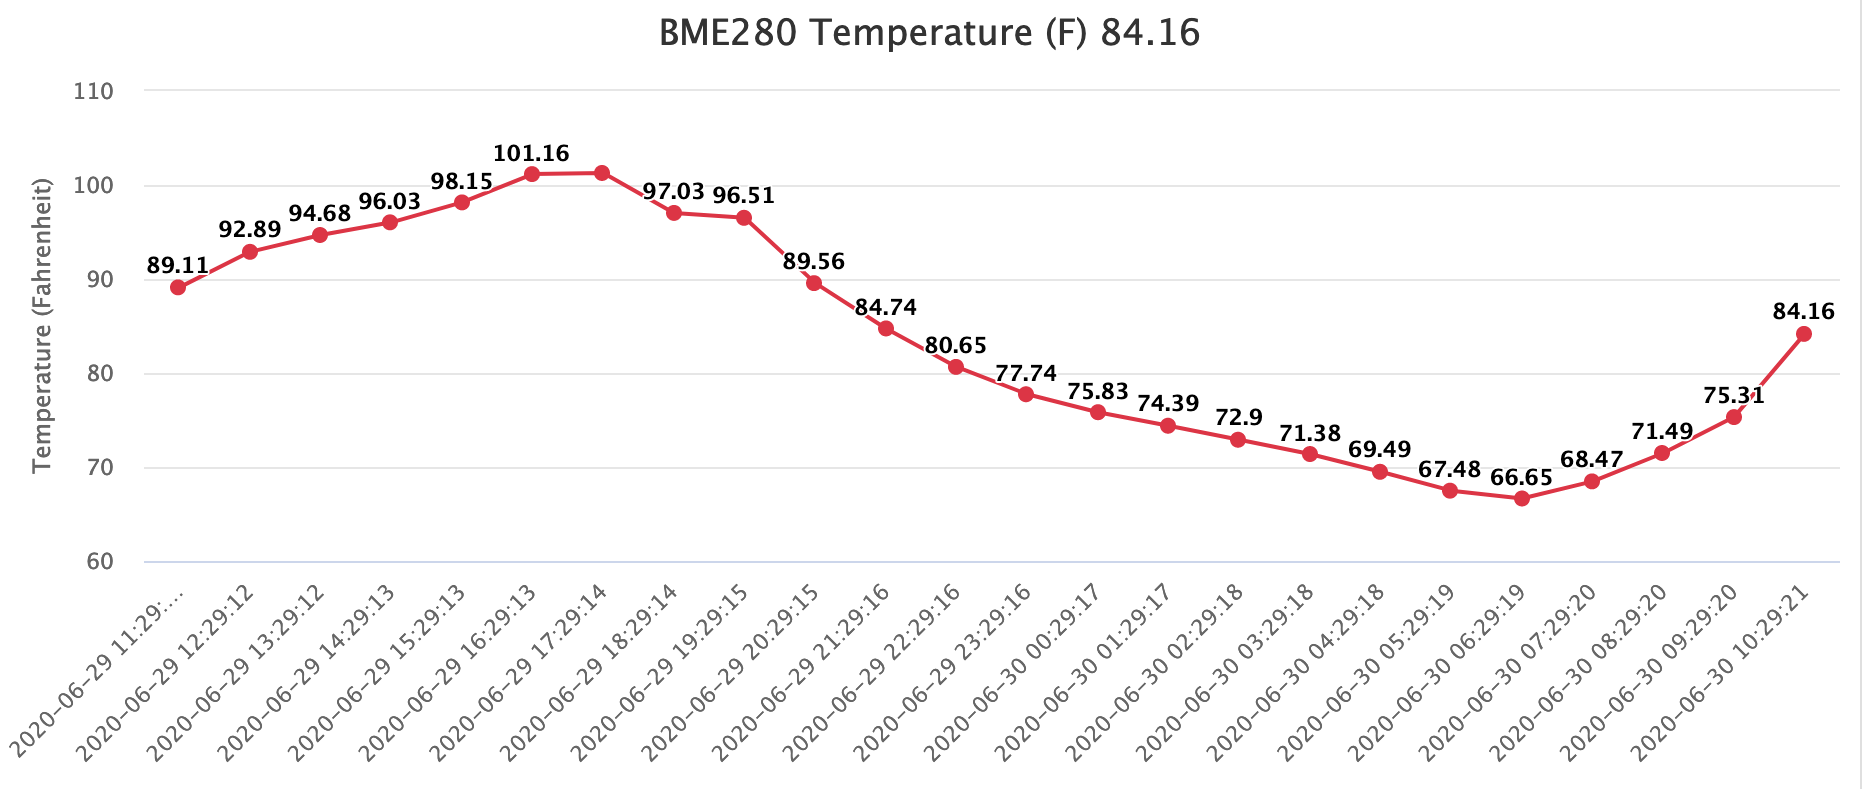
Example of Chart for Temperature in Fahrenheit
The data for this charts is calculated from temperature in Celsius.
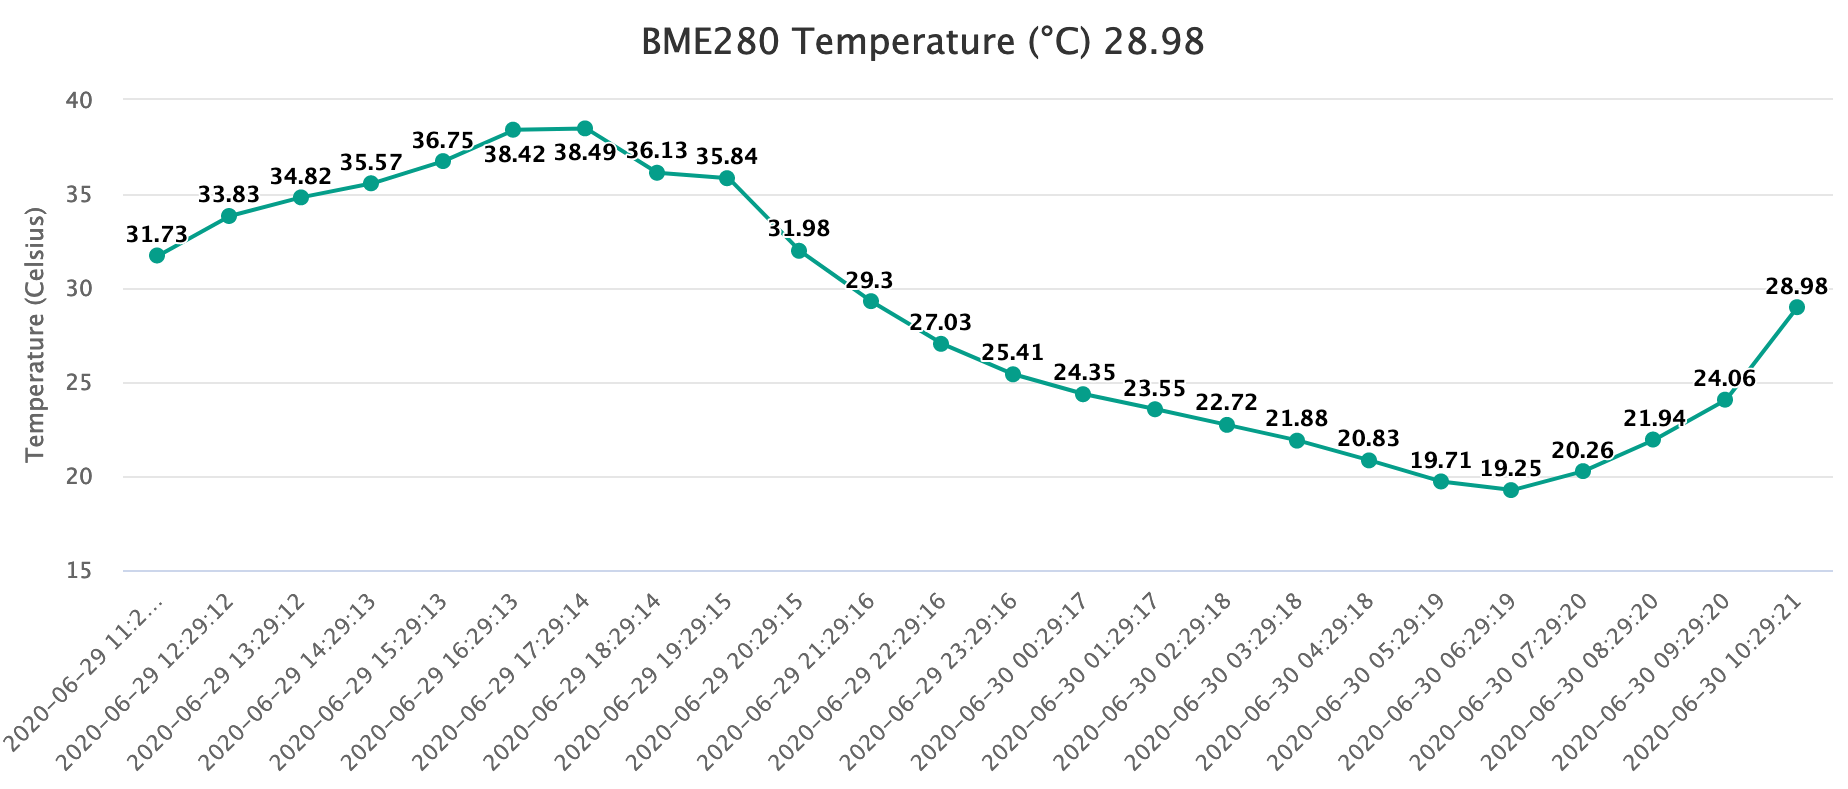
Example of Chart for Temperature in Celsius
The data is taken from ESP itself.
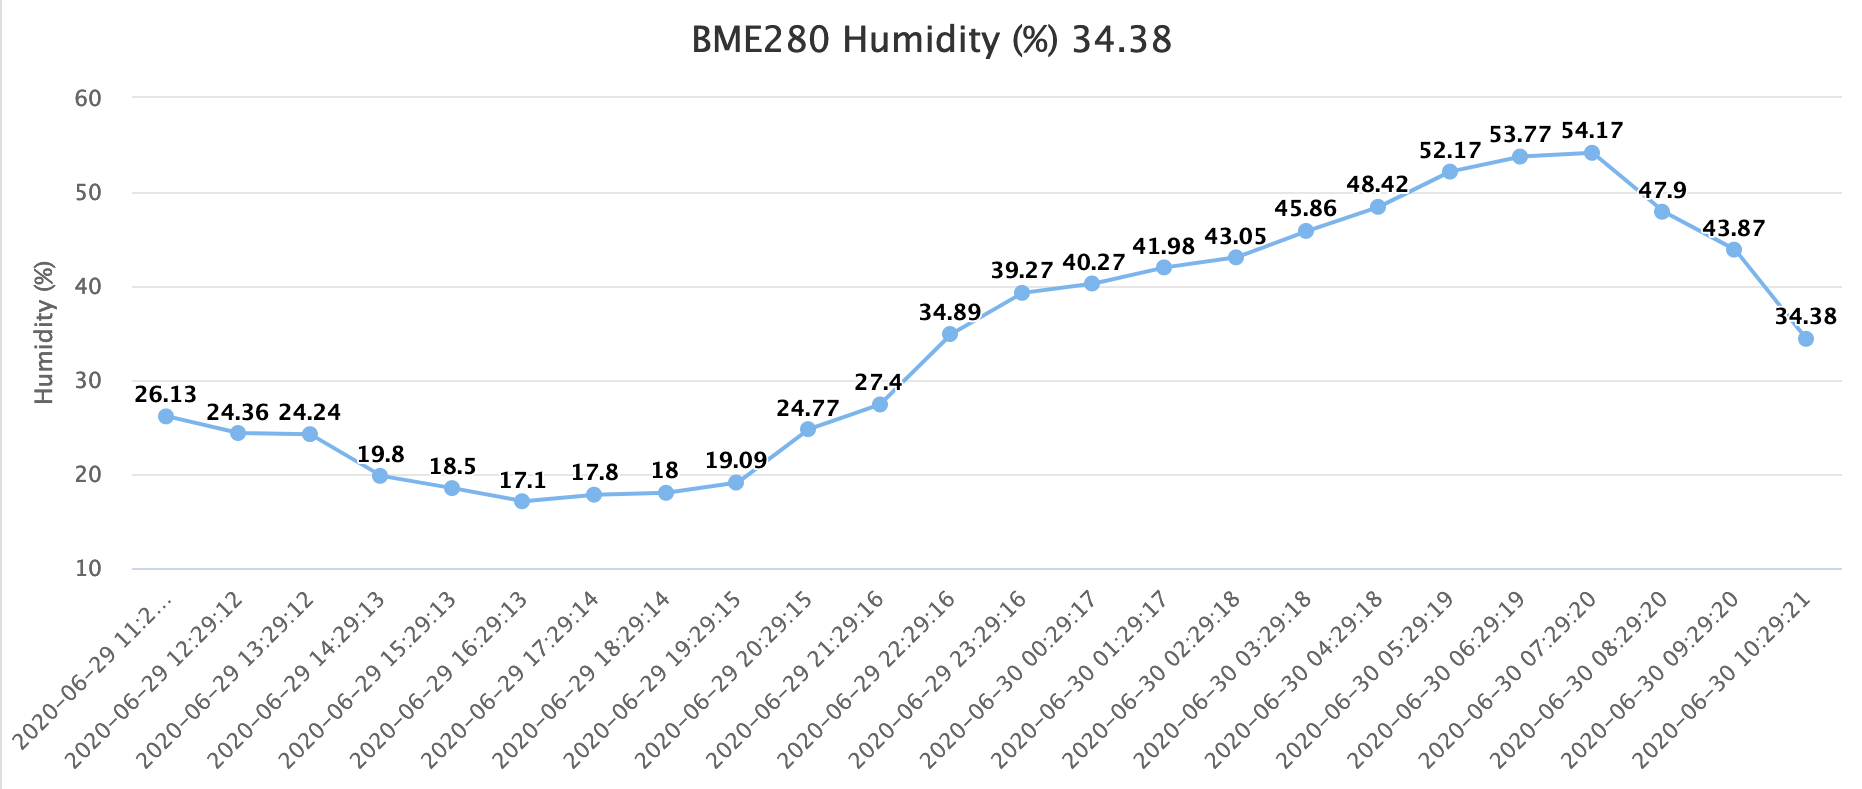
Example of Chart for Humidity
The data is taken from ESP itself.
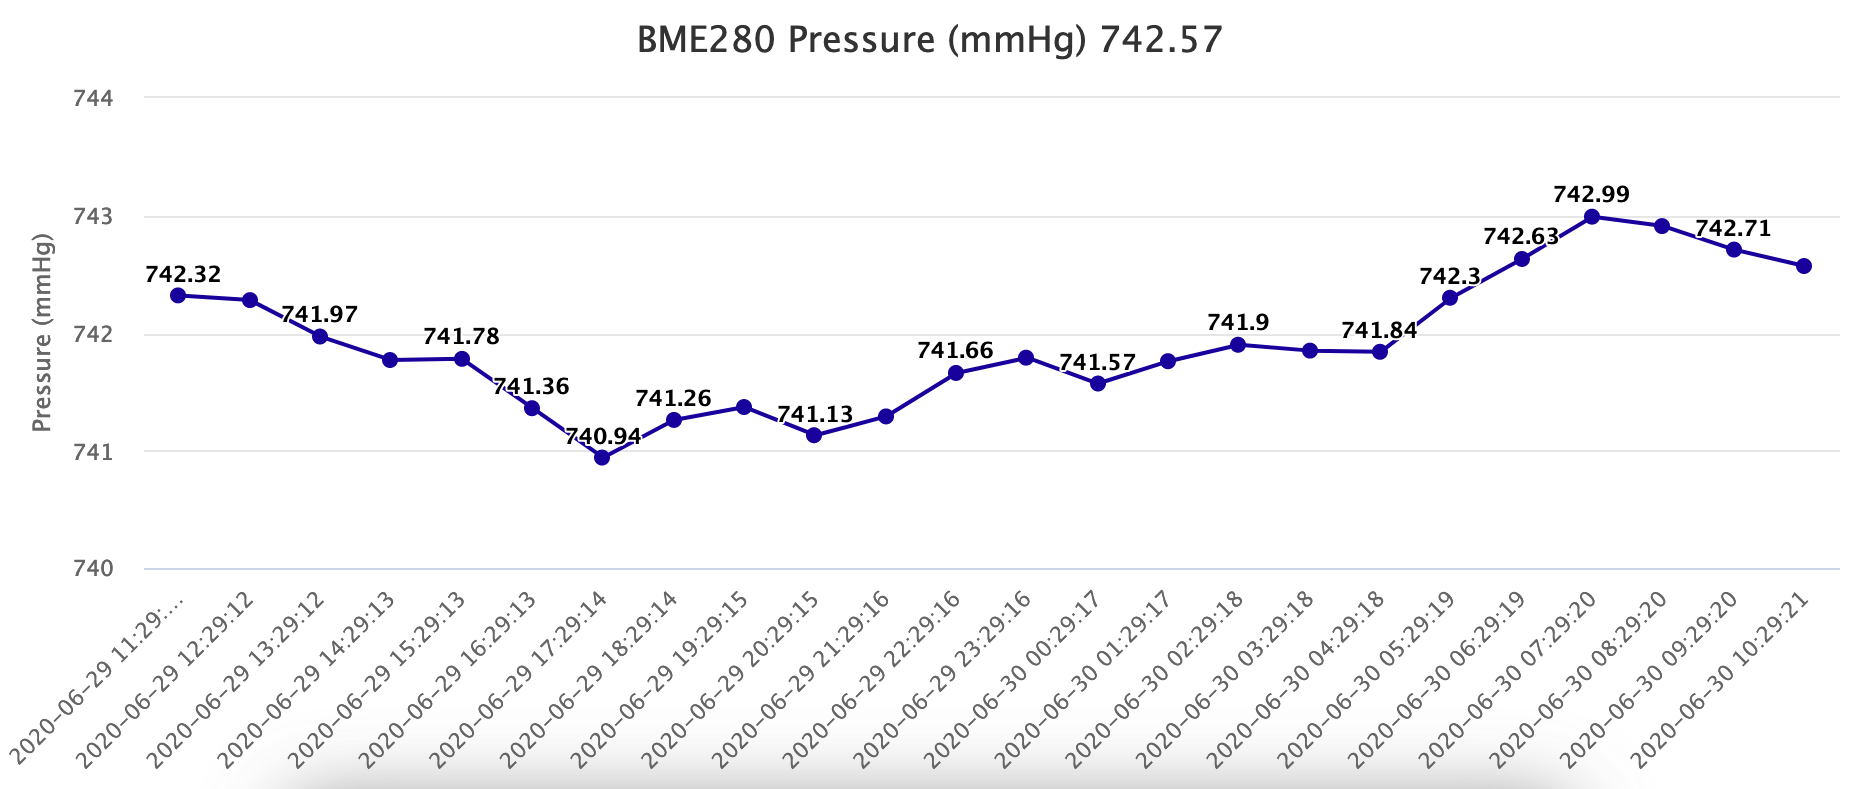
Example of Chart for Air Pressure
The data is taken from ESP itself.